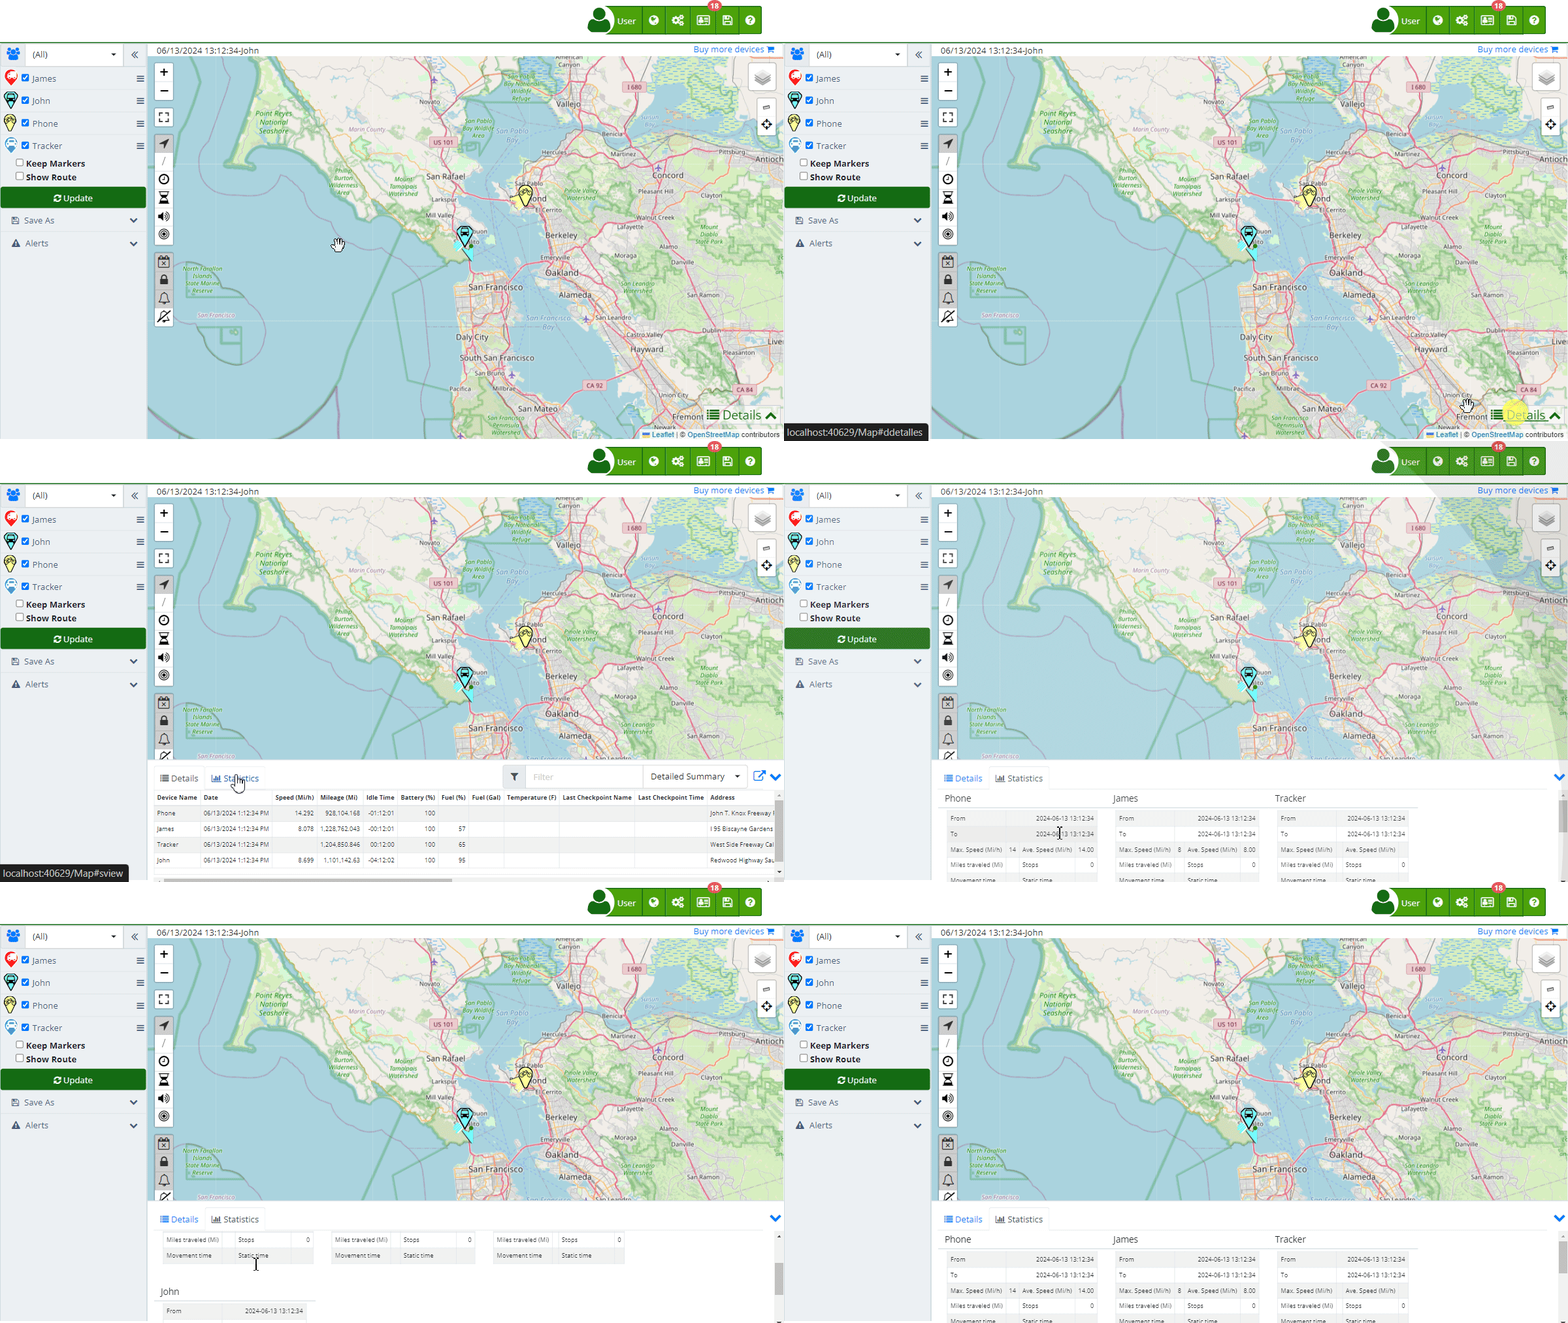
The statistics panel in Plaspy provides a detailed summary of the device's performance during a specific trip. Below are the fields and metrics presented in this section:

Fields and Descriptions
- From: The start date and time of the trip.
- To: The end date and time of the trip.
- Max Speed: The maximum speed reached during the trip, measured in the configured units (Km/h or Mi/h).
- Average Speed: The average speed during the trip, measured in the configured units (Km/h or Mi/h).
- Distance Traveled: The total distance traveled, measured in the configured units (Km or Mi).
- Stops: The total number of stops made during the trip.
- Moving Time: The total amount of time the device was in motion.
- Static Time: The total amount of time the device was stationary.
- Idle Time: (Optional) The total amount of time the device was idling.
- Sensor 1: (Optional) Time that Sensor 1 was active.
- Sensor 2: (Optional) Time that Sensor 2 was active.
- Fuel (%): The percentage of fuel remaining in the tank at the end of the trip.
- Distance per Tank: The distance traveled per tank of fuel, measured in the configured units (Km or Mi).
- Fuel Consumption: The amount of fuel used, measured in liters or gallons.
- Distance per Unit of Fuel: The distance traveled per liter or gallon of fuel.
- Fuel 2 (%): (Optional) The percentage of fuel remaining in a second tank at the end of the trip.
- Distance per Tank 2: (Optional) The distance traveled per second tank of fuel, measured in the configured units (Km or Mi).
- Fuel 2 Consumption: (Optional) The amount of fuel used in the second tank, measured in liters or gallons.
- Distance per Unit of Fuel 2: (Optional) The distance traveled per liter or gallon of fuel from the second tank.
- Min Temperature: The minimum temperature recorded during the trip, measured in the configured units (Celsius or Fahrenheit).
- Max Temperature: The maximum temperature recorded during the trip, measured in the configured units (Celsius or Fahrenheit).
Instructions to View Trip Statistics
- Open the Trips Section: In the left panel, select the device whose trip you want to view.
- Select a Trip: Use the date picker to define the period of the trip you wish to view.
- Show Trip: Check the "Show Route" option and click the "Update" button to display the route on the map.
- Open Statistics Details: At the bottom of the map, click on the "Statistics" tab within the details panel.
Validations and Restrictions
- Date Range: Ensure the selected dates for the trip are within the available data range for the device.
- Sensor Accuracy: Some sensors may not be available for all devices, depending on their capabilities.
Frequently Asked Questions
Why don't I see data for all sensors?
- Ensure the device has the corresponding sensors and that they are enabled and functioning correctly during the trip.
What do the different fuel metrics mean?
- "Fuel (%)" indicates the percentage of fuel remaining. "Distance per Tank" and "Distance per Unit of Fuel" show fuel efficiency.
- Welcome to Plaspy help
- Map
- Viewing a Device's Route History
- Device Control Panel
- Detailed Device Information
- Buttons on the Map
- Details
- Trip Statistics
- Device Menu
- GeoFences
- Bulk Alert Editing
- Enable map notifications
- Mileage Calculation
- Atributes
- Devices
- Marker Icon
- Information
- Sensors
- Reassign Digital Sensors
- Commands
- Alerts
- Types
- Configuration
- Reminders
- Limits
- History
- Setting Up a New Tracker
- Solution for Identifier Already in Use by Another Account
- Device Issues
- Email alerts sending limits
- Reports
- New Report
- My Account
- Billing Information
- Password Change
- Email Notifications
- Telegram Accounts
- Update Mobile Phone Number
- Primary Email
- Alternative Email
- Activate Two-Factor Authentication (2FA)
- Access Log
- Password Recovery
- Recover Username
- Delete Your Account
- Subscription
- Sign Up
- Activation Code
- Payment Methods
- Line Renewal
- Free Version
- Settings
- Organization
- Login
- Contact
- Styles
- Maps
- Email Templates
- Push Notifications
- Telegram Notifications
- WhatsApp Notifications
- Mobile App
- Statistics
- Activity Summary
- Groups
- Users
- Share Access
- SMS
- Mobile Application
- Developers
- Enable the API
- Rest API
- Authentication
- Devices API
- GET /api/devices
- GET /api/devices/{deviceId}
- GET /api/devices/{deviceId}/lastLocation
- POST /api/devices/{deviceId}/locations
- POST /api/devices/{deviceId}/alerts
- Groups API
- GET /api/groups
- POST /api/groups
- GET /api/groups/{groupId}
- PUT /api/groups/{groupId}
- PATCH /api/groups/{groupId}
- DELETE /api/groups/{groupId}
- Users API
- GET /api/users
- POST /api/users
- GET /api/users/countries
- GET /api/users/timeZones
- GET /api/users/{userId}
- PUT /api/users/{userId}
- PATCH /api/users/{userId}
- DELETE /api/users/{userId}
- Embed login on my website
- Embed the map on my website
We answer all support request within 24 business hours approximately, If you have a question that needs an immediate resolution, please contact us by other way.
We answer you in business hours, as soon as possible. We are located in Bogotá, Colombia, time zone (GMT-5).


